Cotality Median Dwelling Values chart
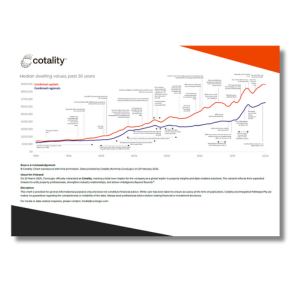
Median Dwelling Values – Australia’s Property Market Over 30 Years
Curious how property values have changed over the decades? This chart shows the median dwelling values across Australia’s capital cities over the past 30 years — helping you understand long-term trends and cycles in the property market.
It’s the same chart referenced in page 52 of How to Retire on $3,000 a Week, and it gives you a real-world view of how property values have grown — and where they’ve dipped — across different regions. Whether you’re tracking performance, reviewing your strategy, or just love data, this is a powerful reference point.
Source & Acknowledgement
© Cotality. Chart reproduced with kind permission. Data provided by Cotality (formerly CoreLogic) on 20 February 2025.
About the Rebrand
On 25 March 2025, CoreLogic officially rebranded as Cotality, marking a bold new chapter for the company as a global leader in property insights and data-enabled solutions. The rebrand reflects their expanded mission to unify property professionals, strengthen industry relationships, and deliver Intelligence Beyond Bounds™.
Disclaimer
This chart is provided for general informational purposes only and does not constitute financial advice. While care has been taken to ensure accuracy at the time of publication, Cotality and Integrated Pathways Pty Ltd make no guarantees regarding the completeness or reliability of the data. Always seek professional advice before making financial or investment decisions.