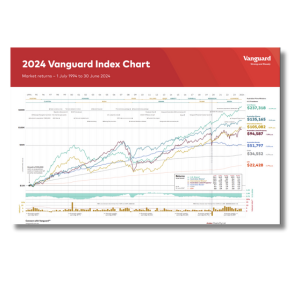
Vanguard 30-Year Index chart

Vanguard 30-Year Index Chart (1994–2024)
Want to see how the markets have actually performed over time? This downloadable chart from Vanguard shows the 30-year performance of major asset classes from 1 July 1994 to 30 June 2024.
It’s a fantastic visual reference if you’re trying to understand long-term investment returns, the power of compounding, and how different markets behave over time. Whether you’re just getting started or revisiting your strategy, this chart helps you zoom out and get perspective.
This resource is referenced on page 56 in How to Retire on $3,000 a Week and is provided here to support your learning.
🔗 For more information, please visit vanguard.com.au
Important Information & Copyright
This publication contains factual information only that is of a general nature. It does not contain financial product advice. We have not taken your objectives, financial situation or needs into account when preparing the information so it may not be applicable to your circumstances.
Vanguard Investments Australia Ltd (ABN 72 072 881 086 AFSL 227263) recommends that, before you make any financial decision about whether to invest in any financial product, you seek professional advice from a suitably qualified adviser.
Past performance information is given for illustrative purposes only and should not be relied upon as, and is not, an indication of future performance. This publication was prepared in good faith and we accept no liability for any errors or omissions.
© 2024 Vanguard Investments Australia Ltd. All rights reserved. Vanguard Investments Australia Ltd pays a subscription fee to Andex Charts Pty Ltd.