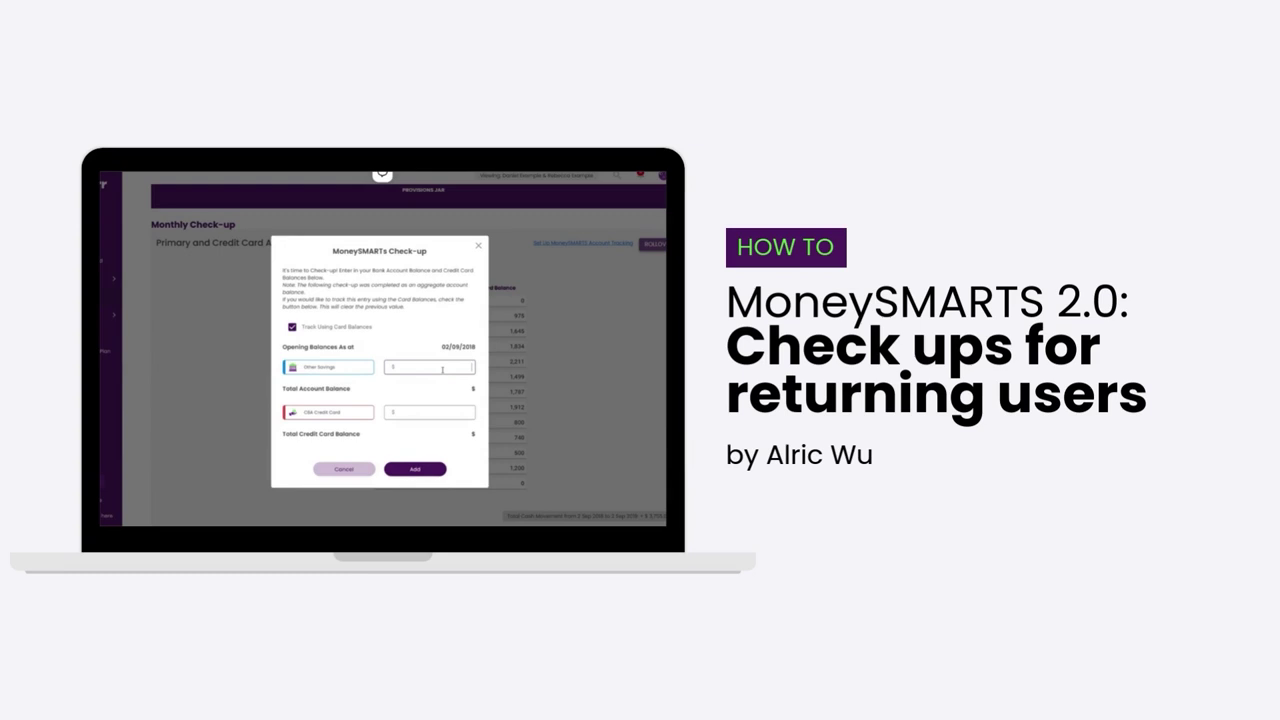
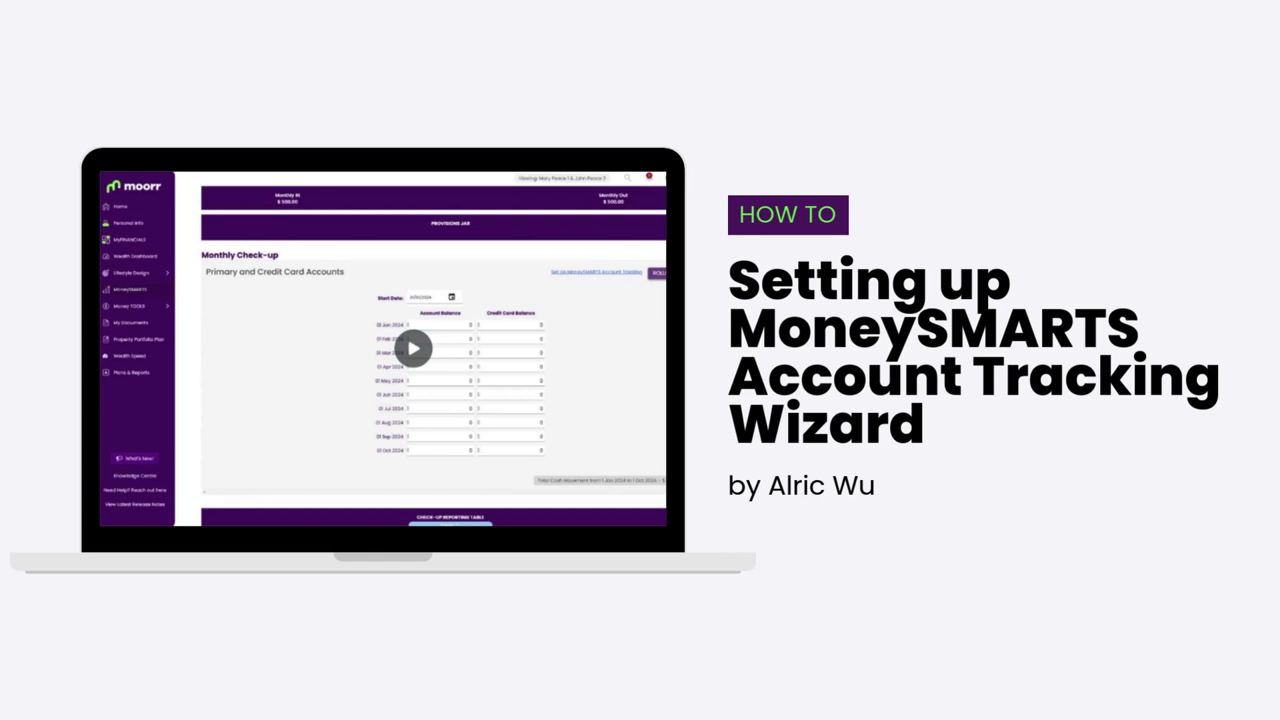
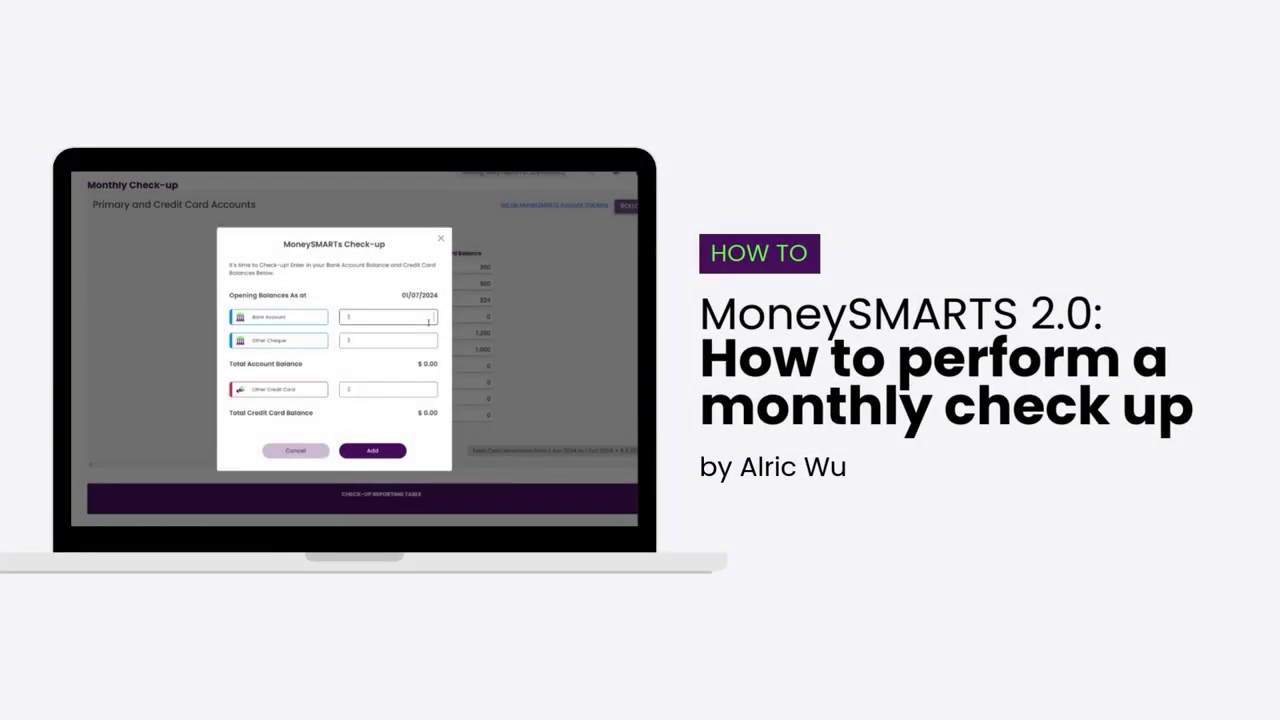
The data in the chart is derived from the Provisions Jar tab on the Money SMARTS Page.
If you’re keen to find it, simply go to:
- The MoneySMARTS Dashboard.
- Look for the “Provisions Jar” and click on it.
- Scroll down and you’ll see the spent amount “Total Provision Balance” row.
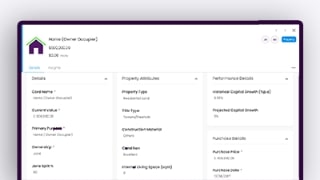
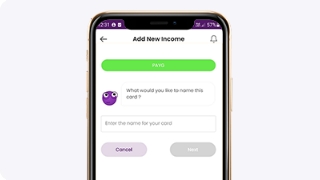
- The bar chart in the Monthly Provision Spent is basically the spent amount in the “Total Provisions Balance” but broken down on a monthly basis. See screenshots below.


👉 To learn more about how to implement MoneySMARTS, click here.
