When Australia’s latest Federal Budget reignited the debate around negative gearing, the conversations inside the Moorr office moved quickly from headlines to one simple question:
What does this actually mean for property investors over the long term?
Like many Australians interested in property and wealth creation, the team at Moorr wanted to better understand how different policy settings could impact investment property cash flow, holding costs, rental income and long-term wealth accumulation.
What started as an internal modelling tool has now become one of Moorr’s newest public features:
Introducing the Negative Gearing Analysis Tool
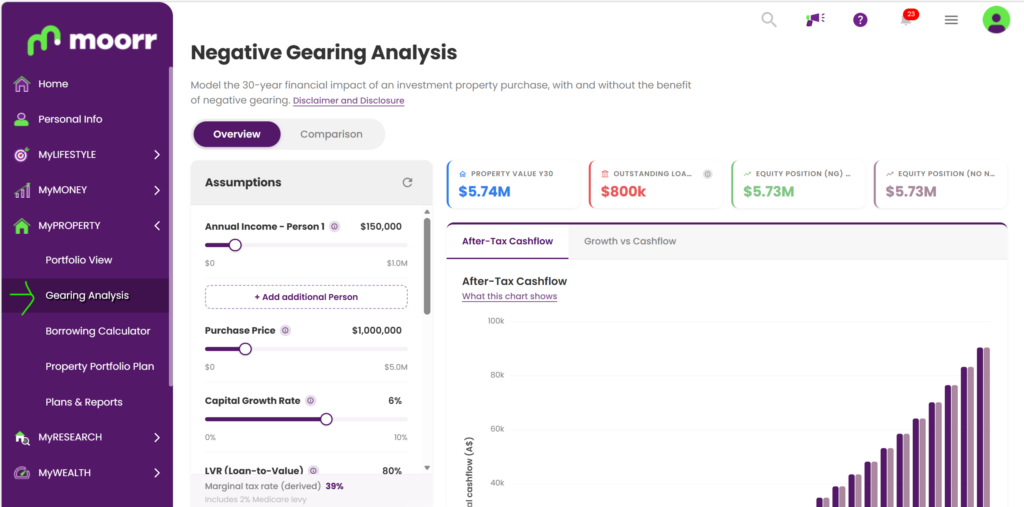
Available inside Moorr’s MyPROPERTY section, the new Negative Gearing Analysis Tool allows users to model and compare different property investment scenarios in a safe, educational “sandbox” environment.
Rather than focusing on hype or fear around tax policy changes, the tool is designed to help investors visualise how different assumptions can affect:
- Property cash flow
- Holding costs
- Capital growth outcomes
- Long-term wealth accumulation
- The impact of negative gearing vs no negative gearing
Importantly, the tool is educational in nature and does not provide financial advice.
Why We Built This Feature
The idea came together almost immediately after the Budget announcement.
The team had been discussing potential negative gearing reforms and running different investment scenarios internally to better understand the practical implications.
But one thing became clear very quickly:
Many investors were struggling to separate short-term tax conversations from long-term investment fundamentals.
That insight led the team to make the tool available to all Moorr users, allowing everyday investors to explore and compare different scenarios themselves.
What Can You Do Inside the Tool?
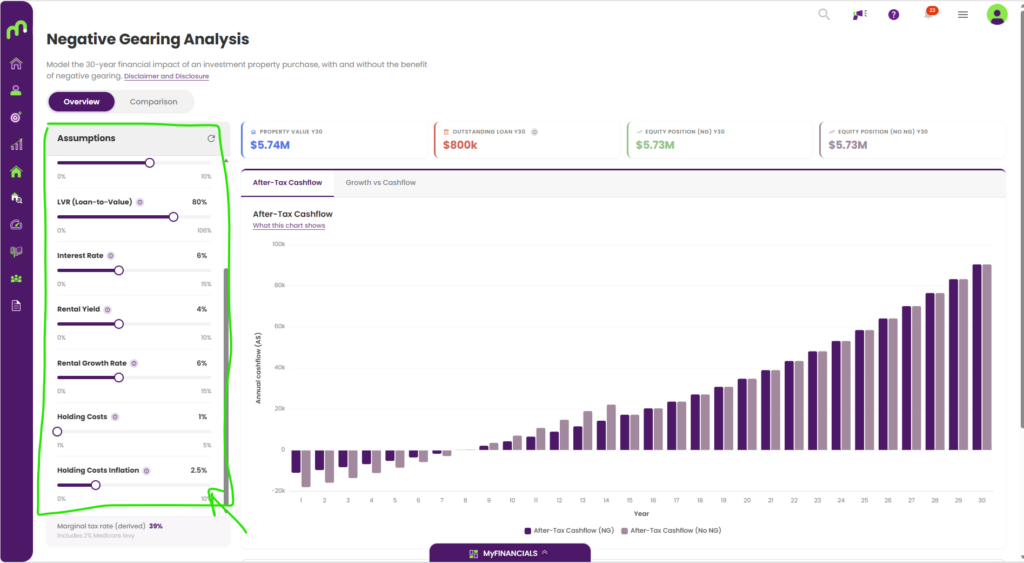
The feature is intentionally flexible, allowing users to adjust assumptions and see how outcomes change over time.
Users can customise variables including:
- Income levels
- Joint ownership splits
- Purchase price
- Growth rates
- Loan-to-value ratios
- Interest rates
- Rental yields
- Rental growth assumptions
- Holding costs
- Inflation assumptions
The tool then generates interactive charts and 30-year projections showing how these assumptions may influence cash flow and long-term wealth outcomes.
Comparing Negative Gearing vs No Negative Gearing
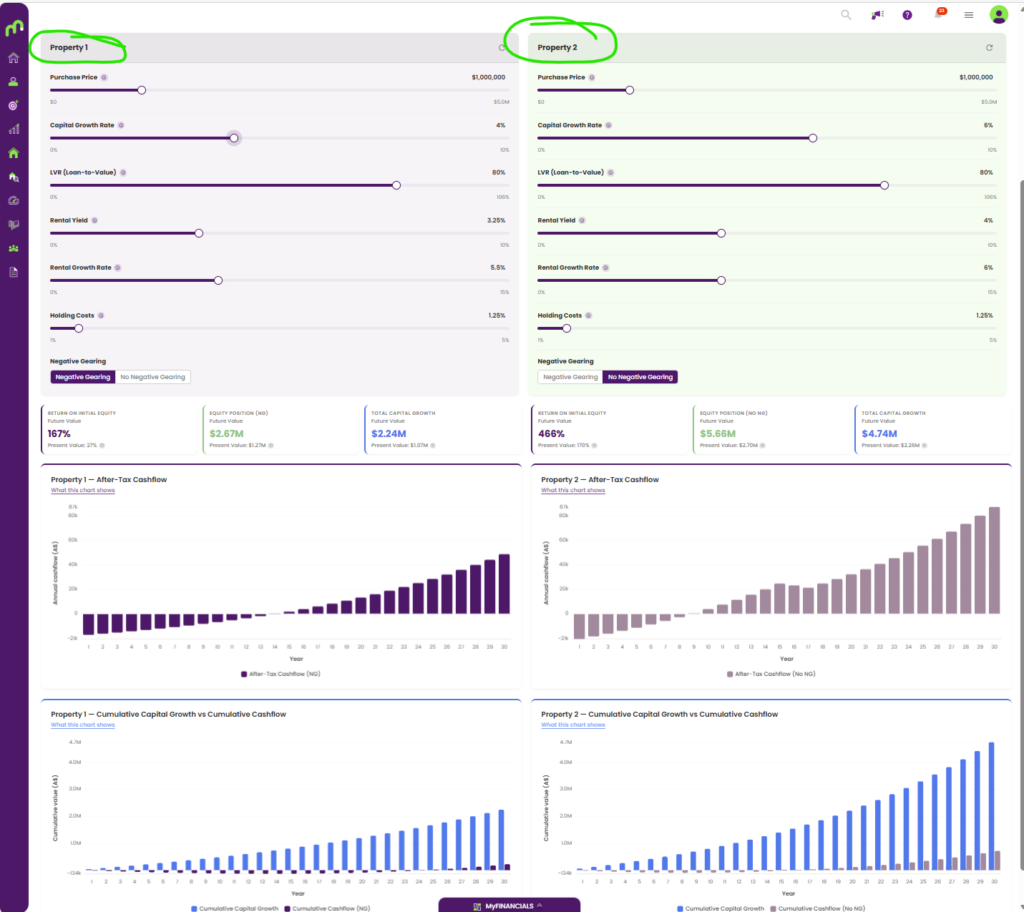
One of the most powerful parts of the feature is the ability to directly compare different policy or property scenarios side-by-side.
For example, users can compare:
- A negatively geared property versus a non-negatively geared property
- High-growth, lower-yield properties versus higher-yield, lower-growth properties
- New properties that may retain tax benefits versus established properties that may not
- The same property under different policy settings
This allows investors to move beyond emotional reactions and instead explore how long-term outcomes may differ under varying assumptions.
One Key Insight: Growth Still Matters Most
While negative gearing can assist with holding costs and short-term cash flow pressures, the modelling helps illustrate that long-term wealth accumulation is still largely driven by the growth of the underlying asset.
As Connor explains in the walkthrough, once properties eventually become positively geared and deferred losses are utilised, the differences between scenarios can become far less dramatic over extended timeframes.
That doesn’t mean policy changes are irrelevant — but it does reinforce the importance of focusing on investment fundamentals rather than tax settings alone.
Designed as a Sandbox — Not a Crystal Ball
We are careful to highlight that this feature should be used as an educational modelling tool rather than a prediction engine. Please get qualified professional advice before making any investment decisions. If you’re not sure who to reach out to, our sister company, Empower Wealth would love to assist.
The outcomes generated are entirely dependent on the assumptions entered by the user, and the tool intentionally simplifies certain variables to make comparisons easier.
For example:
- The model assumes interest-only lending for comparison purposes
- Offset accounts are not included
- Properties are assessed in isolation
- Results are illustrative only
This makes it a useful way to stress-test ideas, compare scenarios and better understand the relationship between cash flow, growth and tax settings.
Available Now Inside Moorr via the Webapp
The Negative Gearing Analysis Tool is now available inside the MyPROPERTY section of Moorr.
If you enjoy exploring property scenarios, modelling different investment approaches, or simply want to better understand how policy changes may impact long-term investing outcomes, this feature offers a practical way to experiment with different assumptions and compare the results visually.
If you haven’t explored it yet, jump in and try it now👉
Or create your Free Moorr Account to get started!