Like with any investment assets, if you have one or more of them, you’d like the ability to view and analyse their performance.
Introducing Portfolio View, where you can track, manage and generate charts & reports into your property assets – both personal and investment properties.
Portfolio View also gives you complete control and instant results in how you want to analyse your portfolio. Select any type of combination, from isolating one property to a combination of properties or aggregate and analyse your entire portfolio. It’s time to make the move and say goodbye to your old spreadsheet forever!
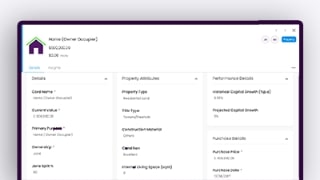
Simply add your property assets details into Moorr via MyFINANCIALS – by creating a property asset card, including purchase, ownership, value details, then by connect your rental income, expenses and borrowings cards, it opens you up to a world of net position, cashflow, tax and lending performance insights.
Keen to learn more? In this walkthrough, our Product Manager, Connor takes you through how it works, what to look for, and a few handy tips to get started.
🎥 Watch the video below to see it in action:
Key Portfolio Metrics & Net Position Over Time
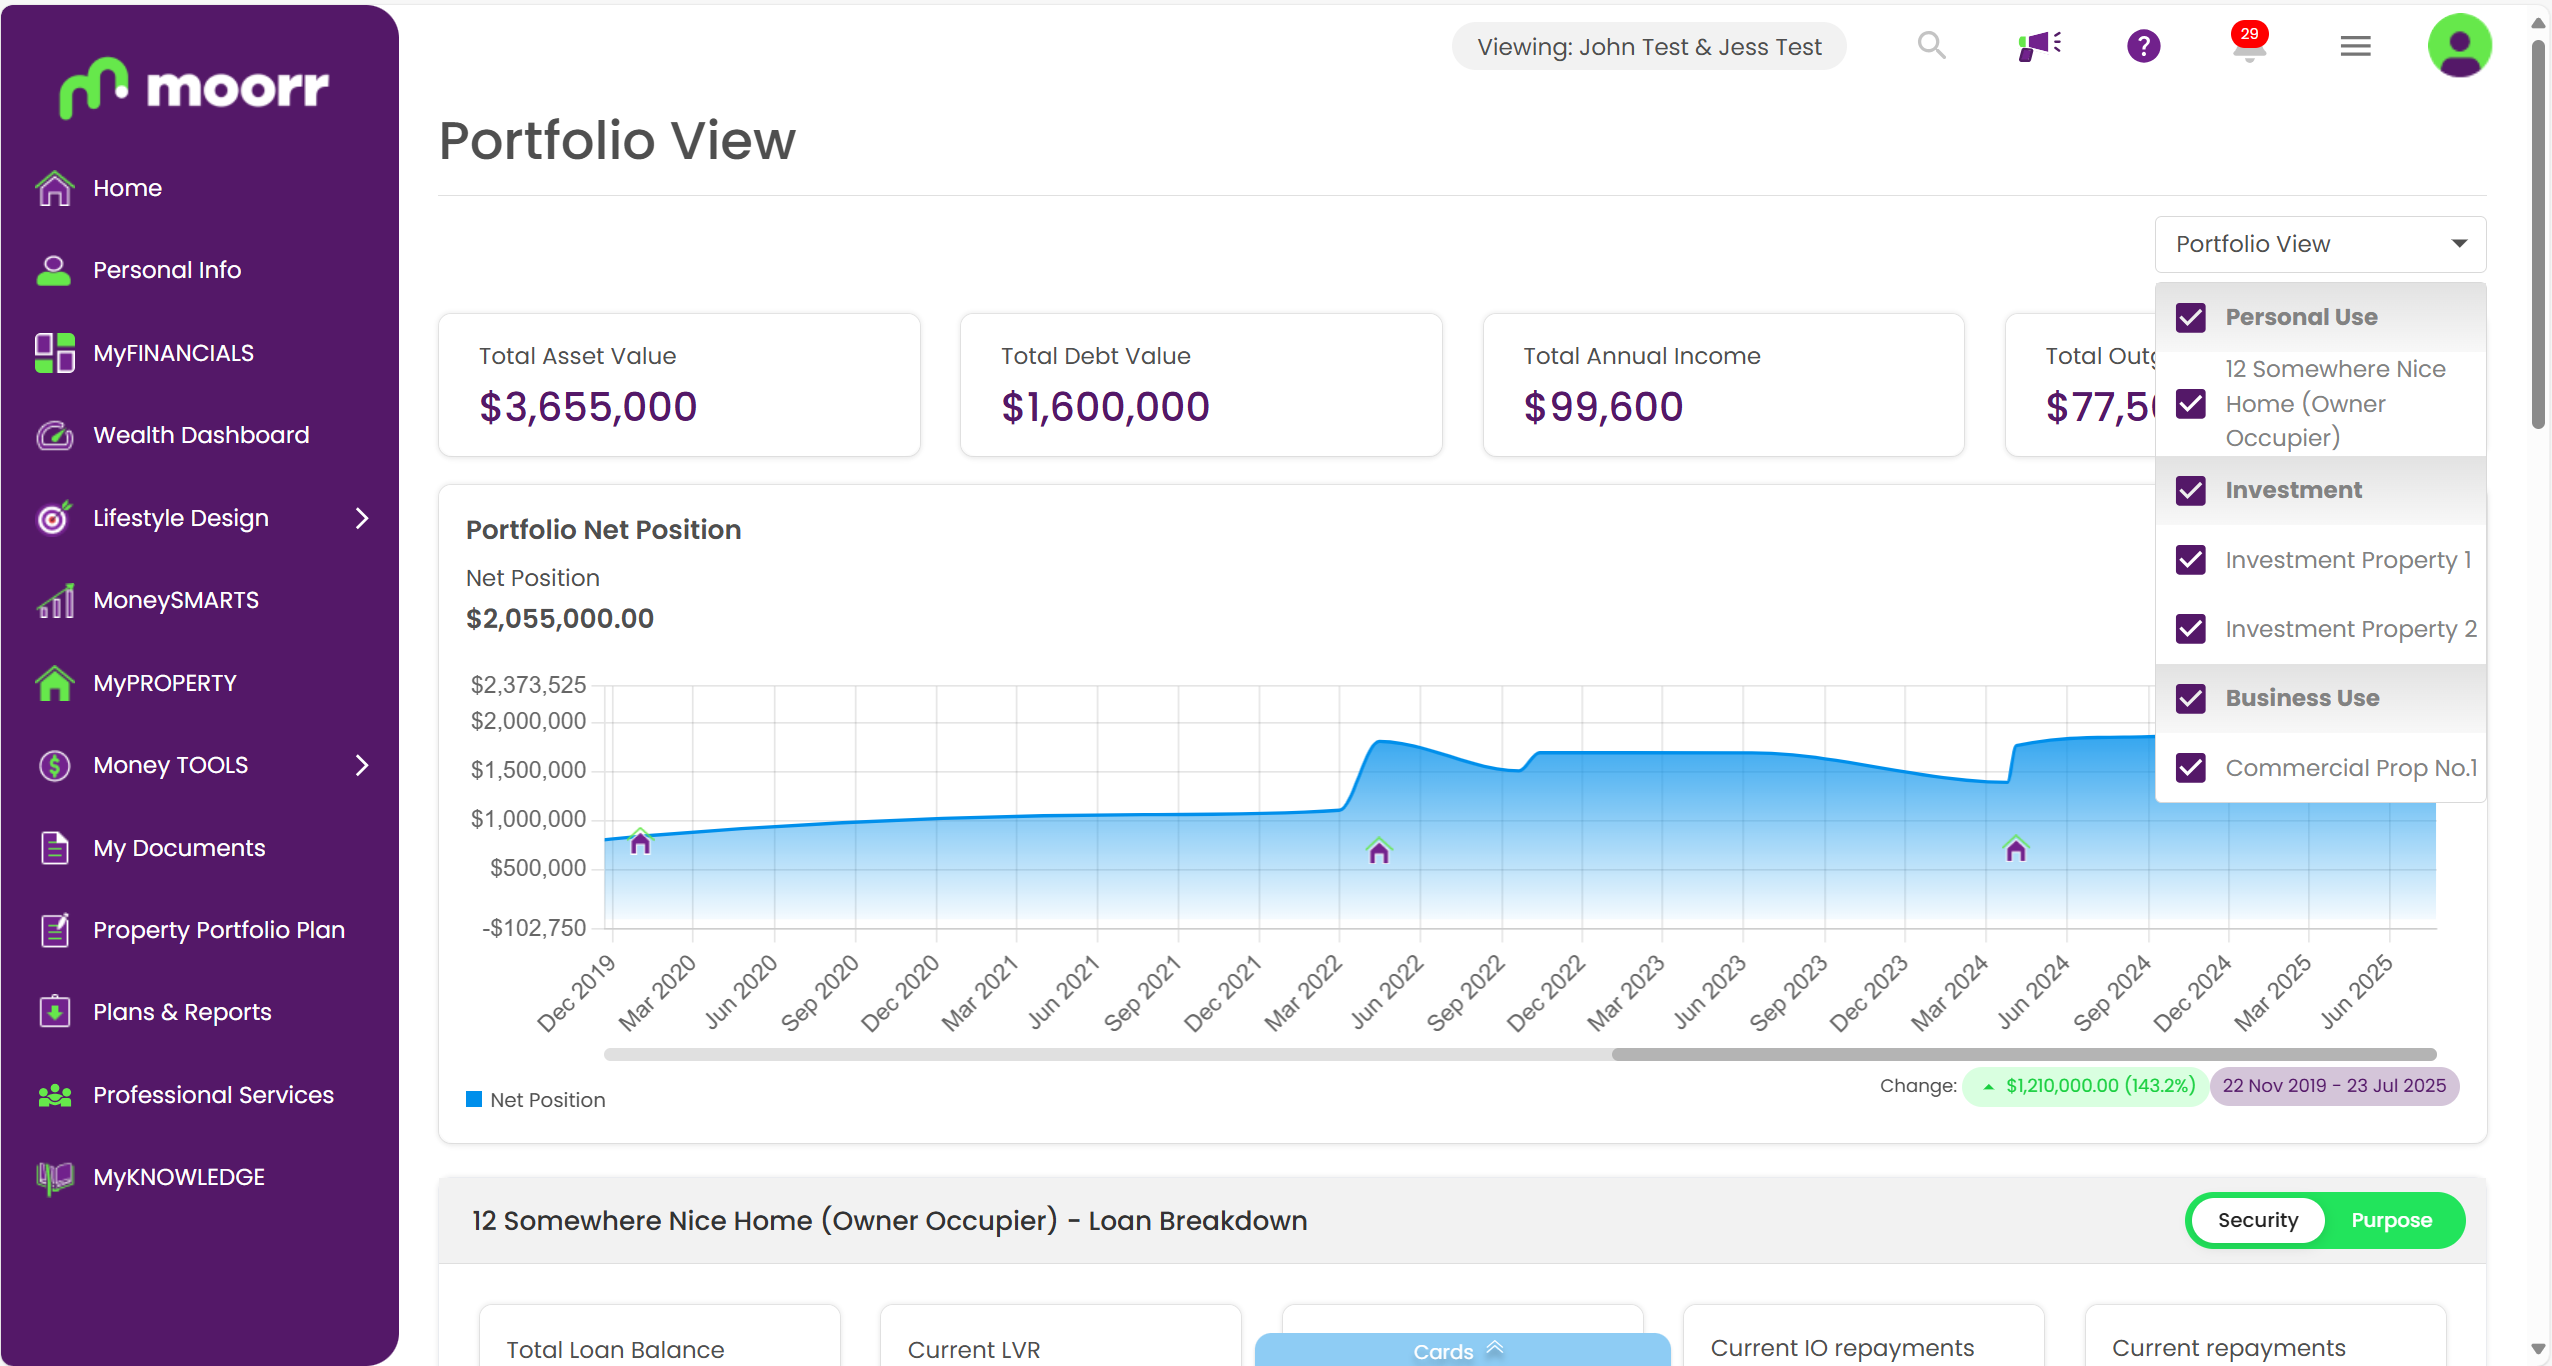
The first place to start is at the top-right corner where you’ll see a “Portfolio View” dropdown. This lets you:
- View your entire portfolio (all properties)
- Select a custom combination of properties (e.g. investment only)
- Drill down into a single property
No matter what you choose, the data below will update based on the values you’ve inputted in Moorr — so you can compare different parts of your portfolio quickly and clearly.
Driven by the Portfolio View selection window, you will get an instant view of the following key performance indicators:
- Total Asset Value
- Total Debt Value
- Total Annual Income
- Total Outgoings
Portfolio Net Position:
This interactive chart tracks the net position of your portfolio over time, from the date of purchase and it’s price to the net equity position created – (Total Assets less Total Liabilities). The time filter allows for 12 months, 3, 5, 10 and Max periods to assess. With each time period selected, users with be served a dynamic history tracking chart, along with the value and percentage change measured over this period.
🏠 Icons on the timeline show when each property was purchased, so you can track equity growth across your journey. If the chart looks off, check the historic values in your property cards.
Portfolio Net Position provides instant, clear and depending on the number of properties selected, multiple dynamic calculations into consolidated views of your portfolio. You will learn about the progress in performance of equity you are building up over time from your property investments.
Loan Breakdown Section
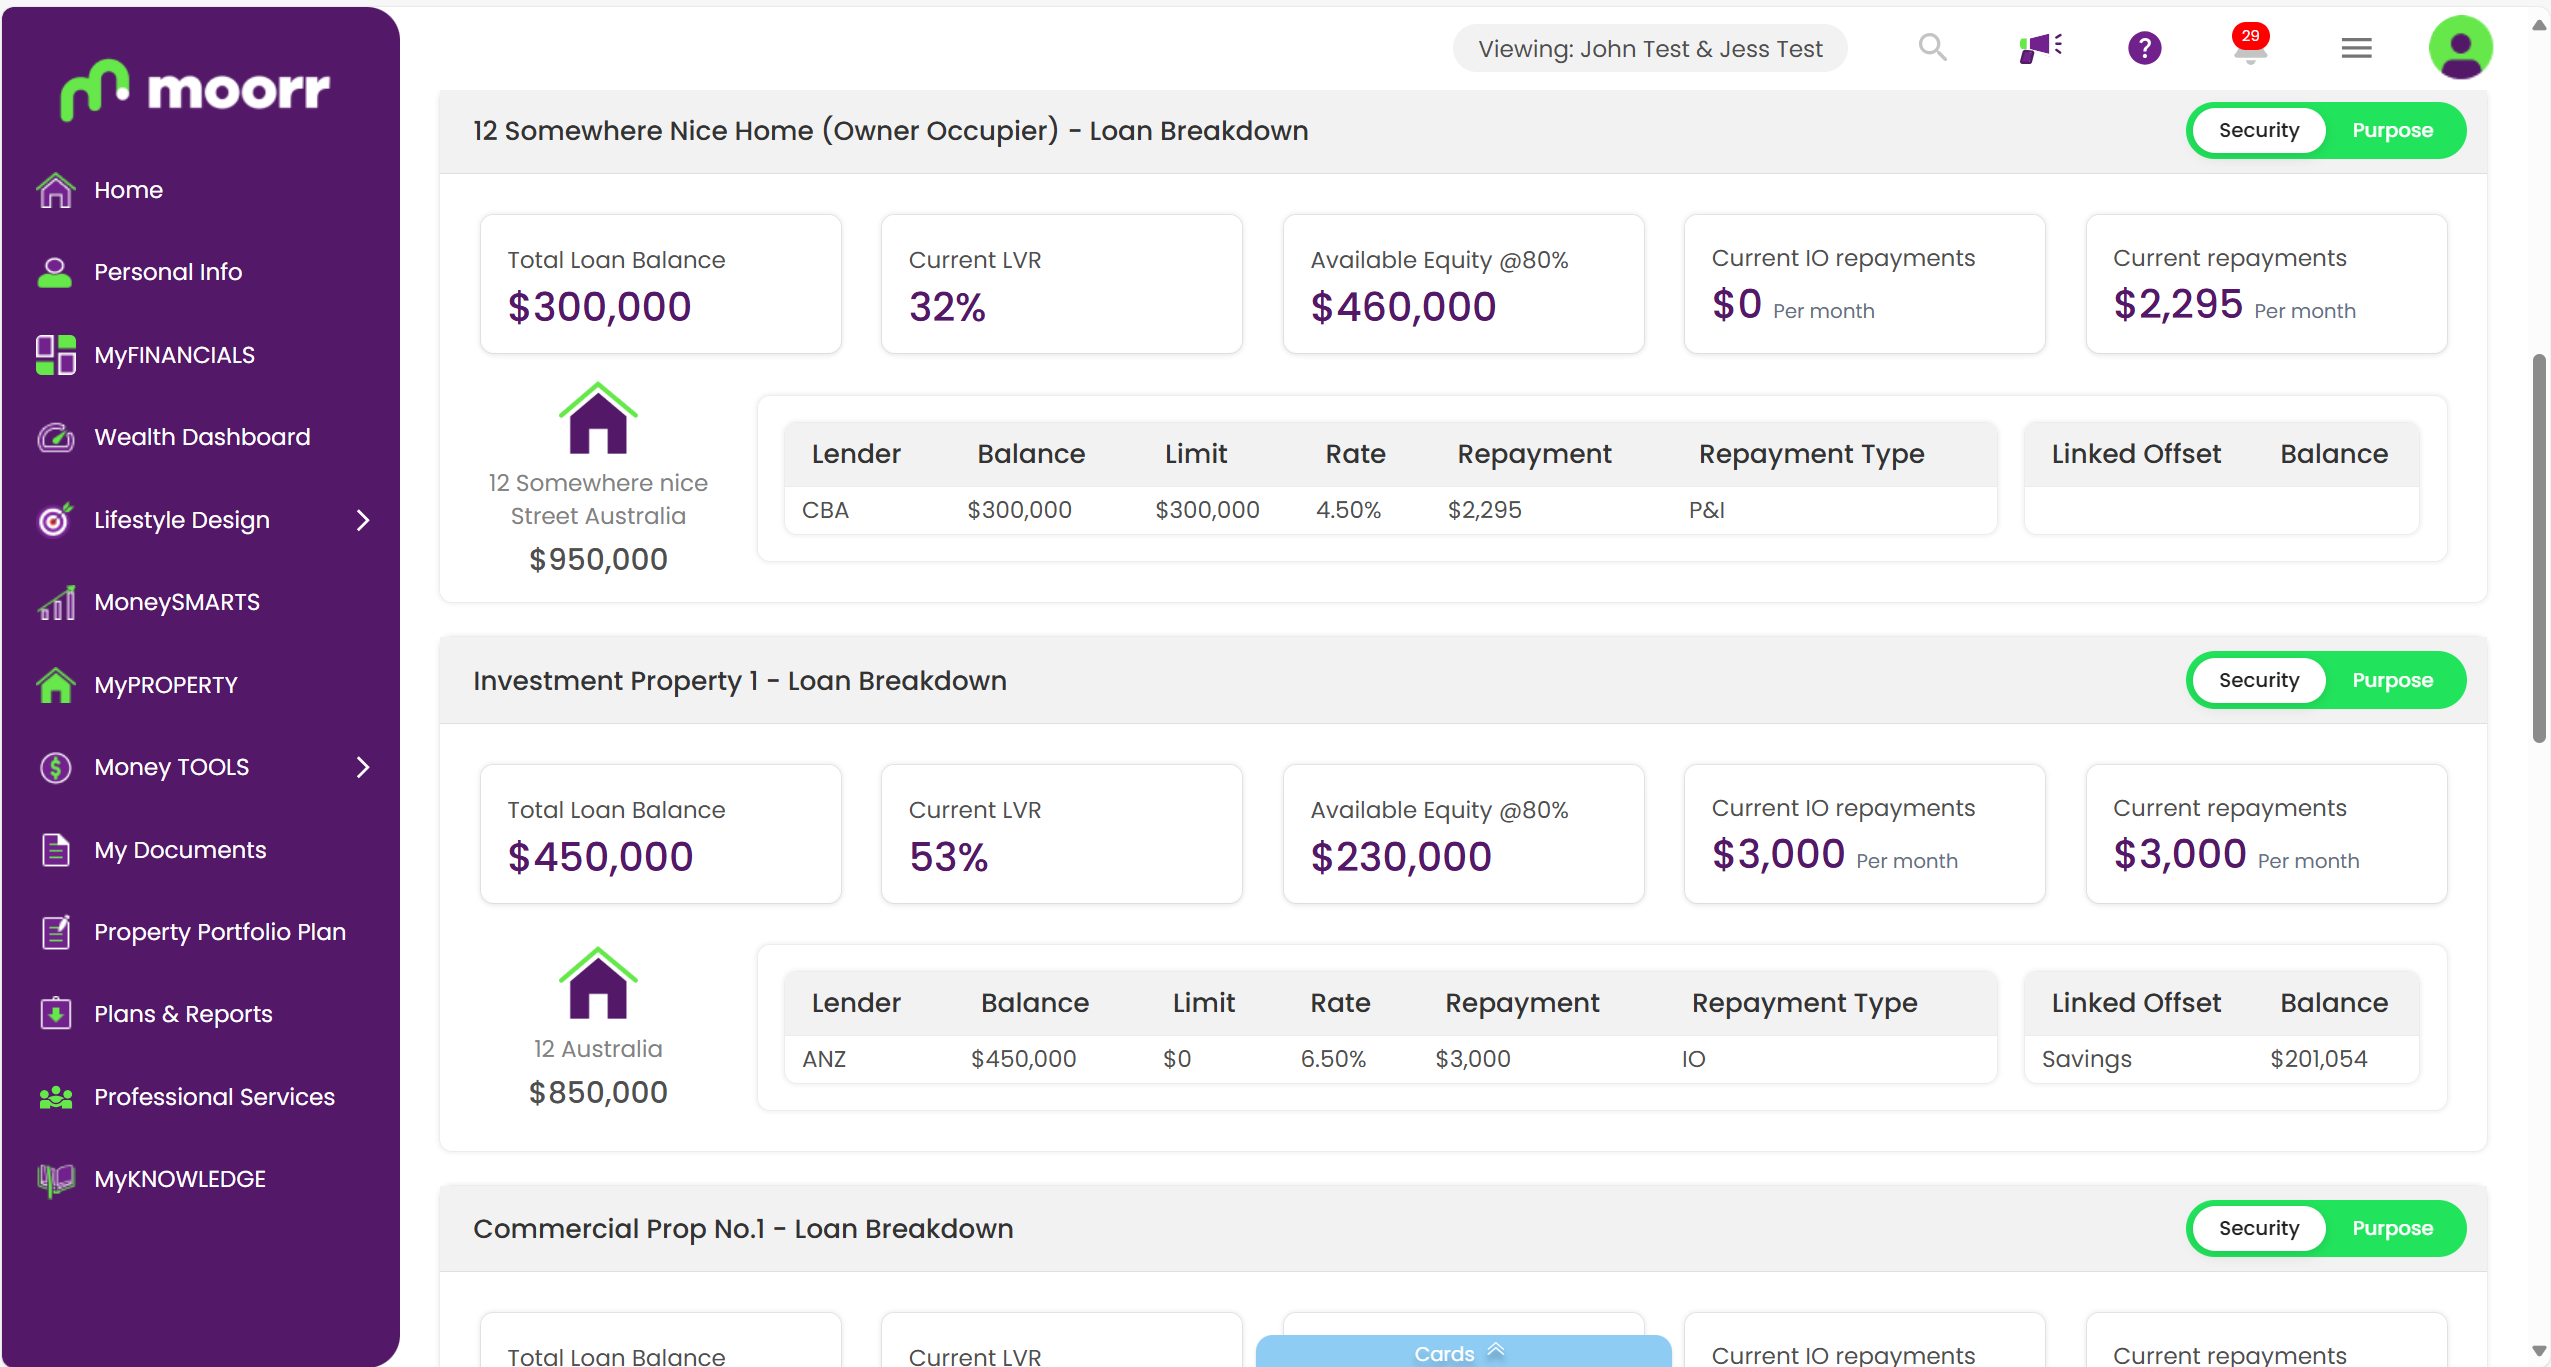
Keeping track of your loans and lending structure is now a breeze. Loan Breakdown is also driven by the Portfolio View selection window. As you select properties your loan structure table appears magically.
With the ability to switch between loan security or purpose, remembering and understanding your lending set-up and structures will never be a problem for you again. This feature is a game-changer for those with growing portfolios.
Data tracking for each loan split indicator includes:
You’ll also see:
- Total Loan Balane
- Loan Limits
- Current Balance
- Lender
- Interest Rate
- Available Equity
- Repayment Type
- Current I/O Repayments
- Current Repayments
- Linked Offsets
- Linked Offset Balances
- Current LVR
If anything looks off, head to the loan card in your property to make adjustments.
Portfolio Cashflow Projection
Every property investor wants to know the next 12-month cashflow results for each of the properties they own. Already a popular feature under each existing property asset card. The introduction of Portfolio Cashflow Projection takes your insights to the ‘next-level’ of ‘aggregated’ incomes, outgoings, pre/post tax and offset account impacts, plus the overall projected cashflow results across your portfolio for the next 12 months.
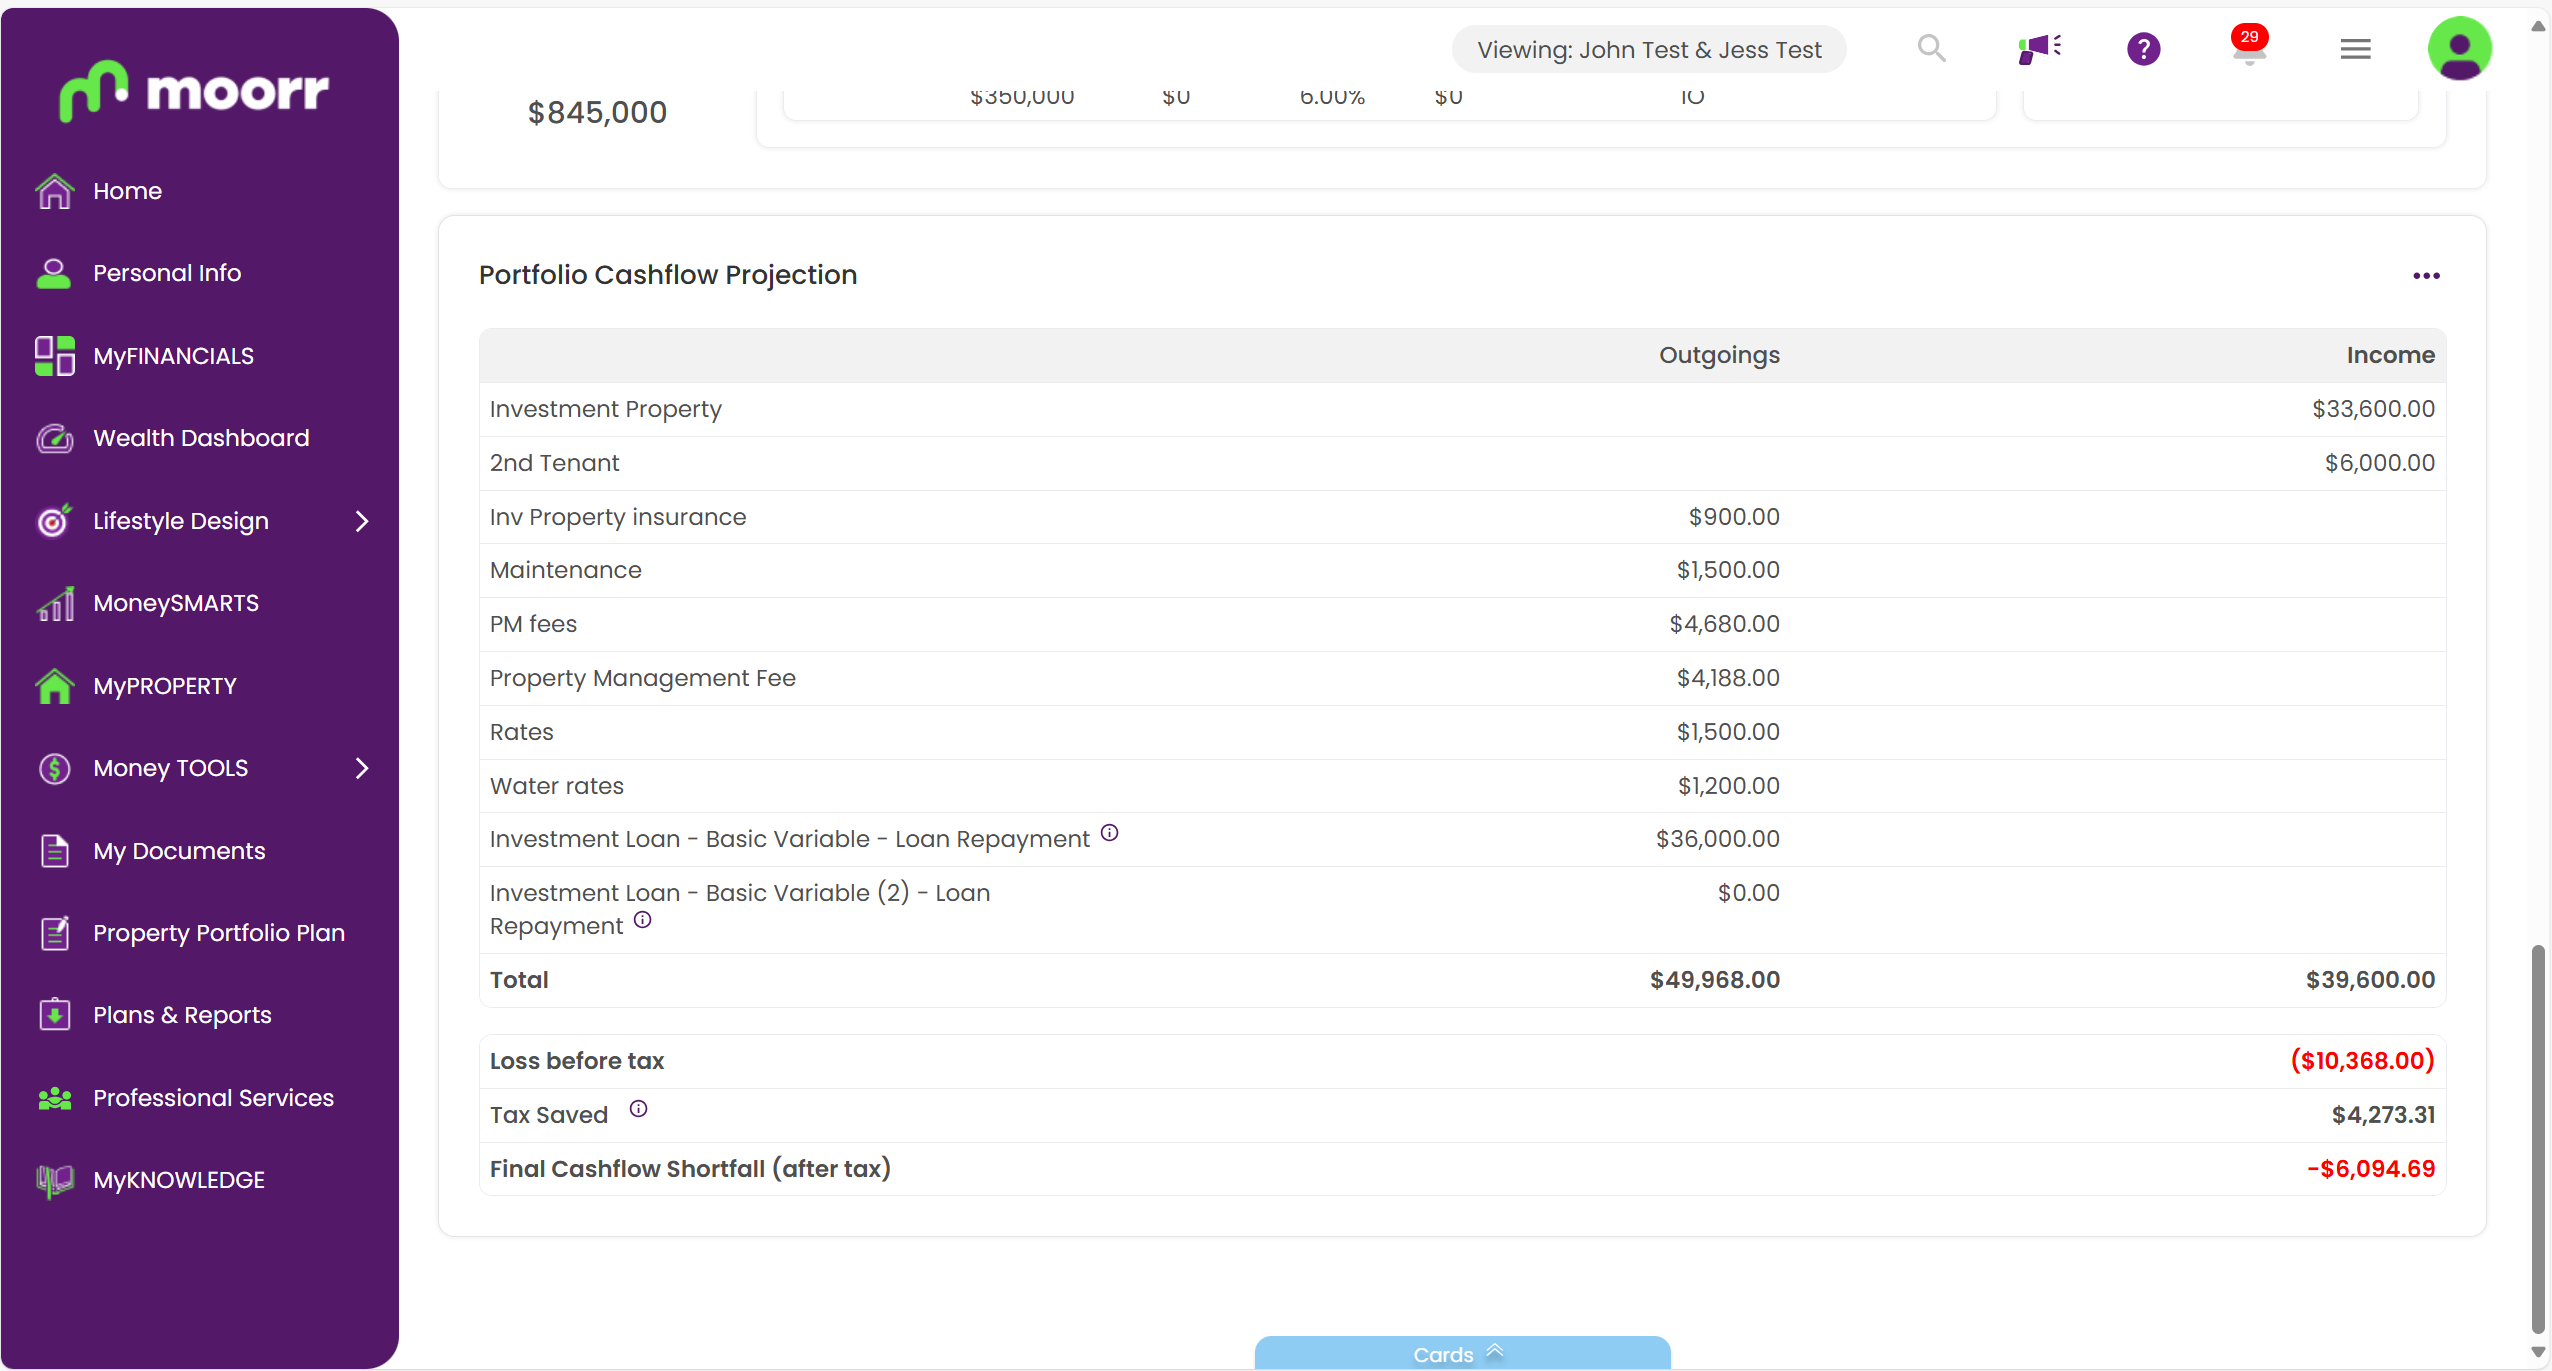
What will be your total rental income and outgoings for the next financial year? Will your property portfolio yield you a positive, neutral or negative cashflow over the next 12 months? Which of your properties is cashflow positive, neutral or negative? How much tax will your save or pay?
The answer to these questions and several more will be at your fingertips with the new Portfolio Cashflow Projection tool in Moorr (webapp).
If you haven’t already made the move, it’s time to ditch the old spreadsheet or whatever current way you try to track and manage your investment properties. Do what over 19,200 fellow property, managing over 35,000 investment properties, have done, and make the switch to Moorr.
You’ll be much clearer on the performance of your properties, you’ll be more organised in tracking and managing them, plus it is bound to save you time and a lot of effort in the process, with all the calculations and insights right in front of you.
We’d Love Your Feedback!
This is a big step forward for the Moorr platform — and we’re only just getting started.
So please, jump in, try it out, and tell us what you think. You can give us feedback in the platform, via the app, in the form below this blog or even via our Helpdesk here. If you’ve got ideas for how we can make it better, we’re all ears.
🔗 Try Portfolio View today: