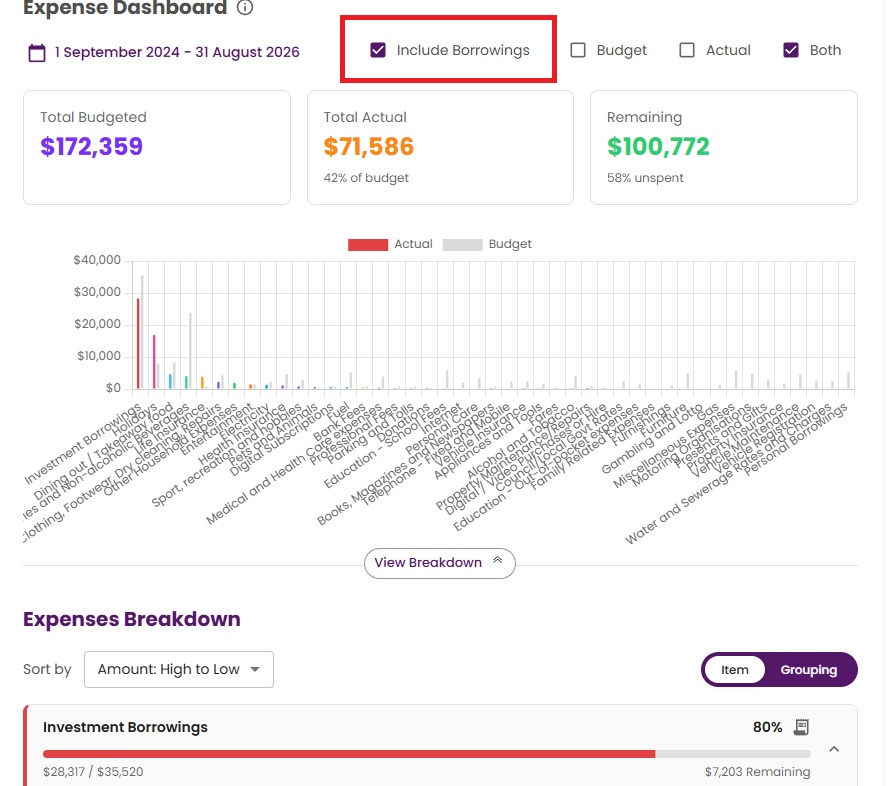
The Expense Dashboard gives you a clear picture of how your actual spending compares to your budget, helping you quickly see where you’re on track and where you might need to adjust. It was first released on the Moorr mobile app, giving you an easy way to keep an eye on your spending and budget wherever you are.
A quick tip: The new Expense Dashboard is even more useful when your transactions are imported into Moorr. It makes it much easier to see and understand where your money is going. Haven’t imported your transactions yet? Find out how Transaction Feeds work.
Here’s how to find it and get the most out of it.
Finding the Expense Dashboard
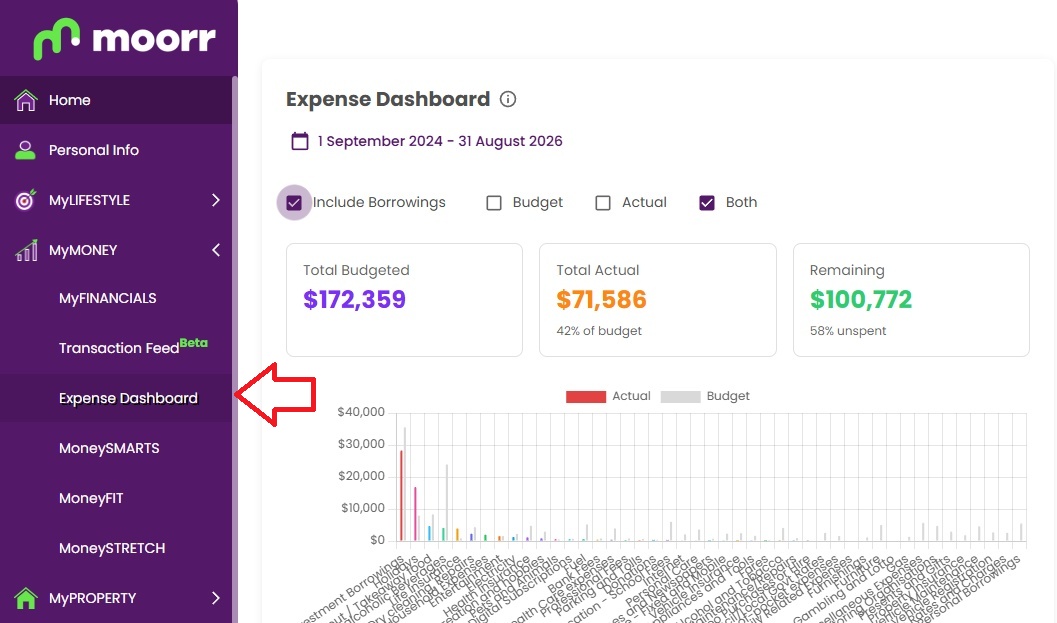
- Log in to Moorr on web.
- In the left sidebar, click MyMONEY.
- Select Expense Dashboard from the submenu.
The dashboard opens with the last 12 months as the default date range.
What you’ll see
The dashboard is split into two panels side by side:
- Left panel – the expense chart and breakdown
- Right panel – a transactions list that updates as you explore
Setting your date range
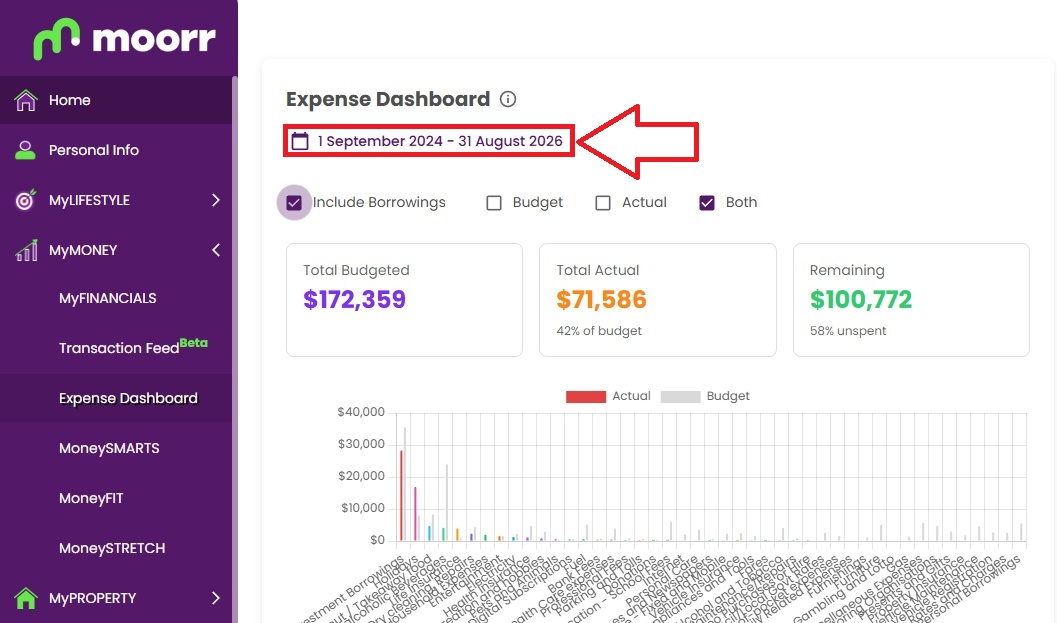
At the top of the chart, you’ll see a date range selector. Click either date to change the period. The chart, totals, and transactions panel all update to match the range you set.
Switching between Budget, Actual and Both
Use the toggle at the top of the chart to change what you’re viewing:
- Budget – shows your planned spending targets only
- Actual – shows what you actually spent in the selected period
- Both – displays budget and actual side by side for each category, making it easy to spot where you’re over or under
Reading the summary tiles
Below the toggle, two summary figures show:
- Total Budgeted – the total of all your budgeted amounts
- Total Actual – the total of all transactions in the selected period
Use the Monthly / Annual toggle to switch between views.
Exploring the expense breakdown
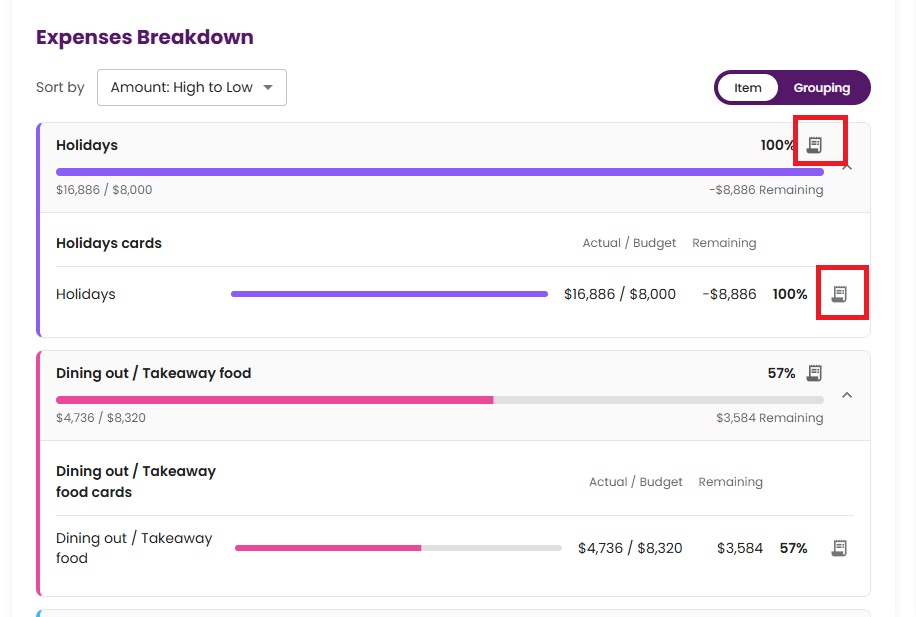
Below the chart, the breakdown lists your expenses either by Item (e.g. Groceries, Subscriptions) or Grouping (e.g. Household Expenses, General Living). Switch between these using the selector.
Each row shows a progress bar comparing your actual spend to your budget. Click the arrow on any row to expand it and see the individual cards underneath, each with their own bar.
Clicking a row or a chart column filters the transactions panel on the right to show only the transactions in that category.
Sorting your expenses
Use the sort dropdown to order the breakdown by:
- Amount (default) – highest to lowest
- Alphabetical – A to Z by category name
- Overspend – surfaces categories where actual spending most exceeds the budget, so you can address problem areas first
Using the Transactions panel
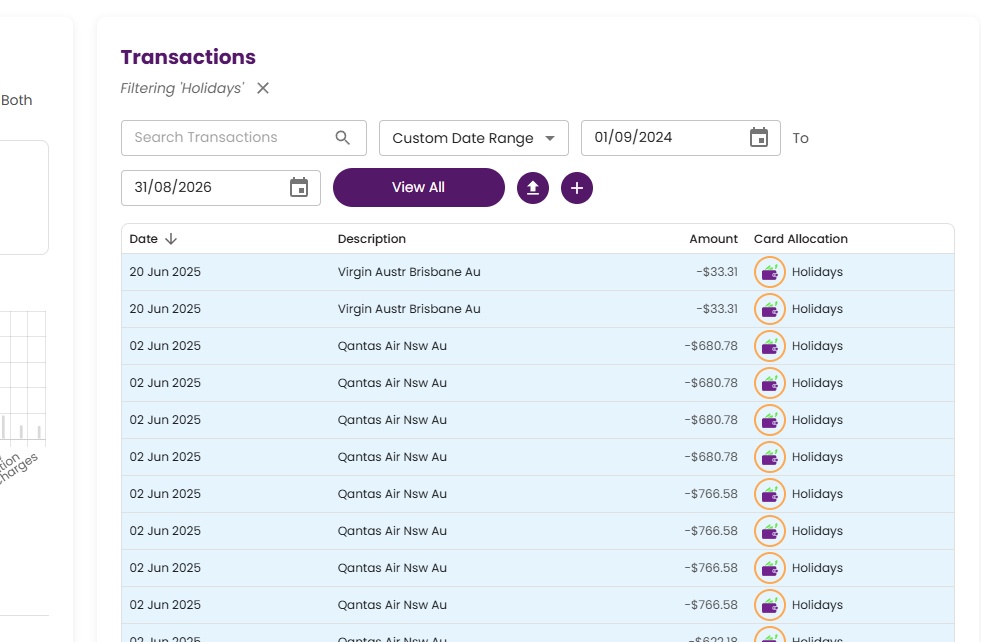
The transactions panel on the right shows the individual transactions that make up the figures in the chart.
- Search – type to filter by description within the selected category and date range
- Add a transaction – use the + button to manually add a transaction
- Upload – import transactions via CSV
- View All Transactions – opens the full Transaction Feed page for full transaction functionality
- Click on a chart category – automatically filters the panel to show only transactions for that category
Transactions display in reverse chronological order (newest first) and paginate in sets you can control.
Tips: Keen to import more transactions? Find out how Transaction Feeds work here >
Including loan repayments
By default, borrowings are not shown. To include them:
- Tick the Include Borrowings checkbox on the dashboard.
- Two new groupings will appear: Personal Borrowings and Investment Borrowings.
- These show your scheduled repayment as the budget, and your actual repayments for the period as the actual.
Note: credit cards are excluded to avoid double-counting, as those transactions are already captured through your expense cards.
Additional Tips:
- Use the Both view with Sort by Overspend to quickly find where you’re consistently going over budget.
- Adjust the date range to match a specific period (e.g. a financial quarter) for more targeted analysis.
- Click any expense row to instantly see which transactions are driving that number in the panel on the right.