Ever wondered where all your household income is meant to go each month? Between mortgage repayments, groceries, bills, holidays, school fees and everything else, it can be tricky to see how your money fits together. Well, we’ve just made that a whole lot easier! 🎉
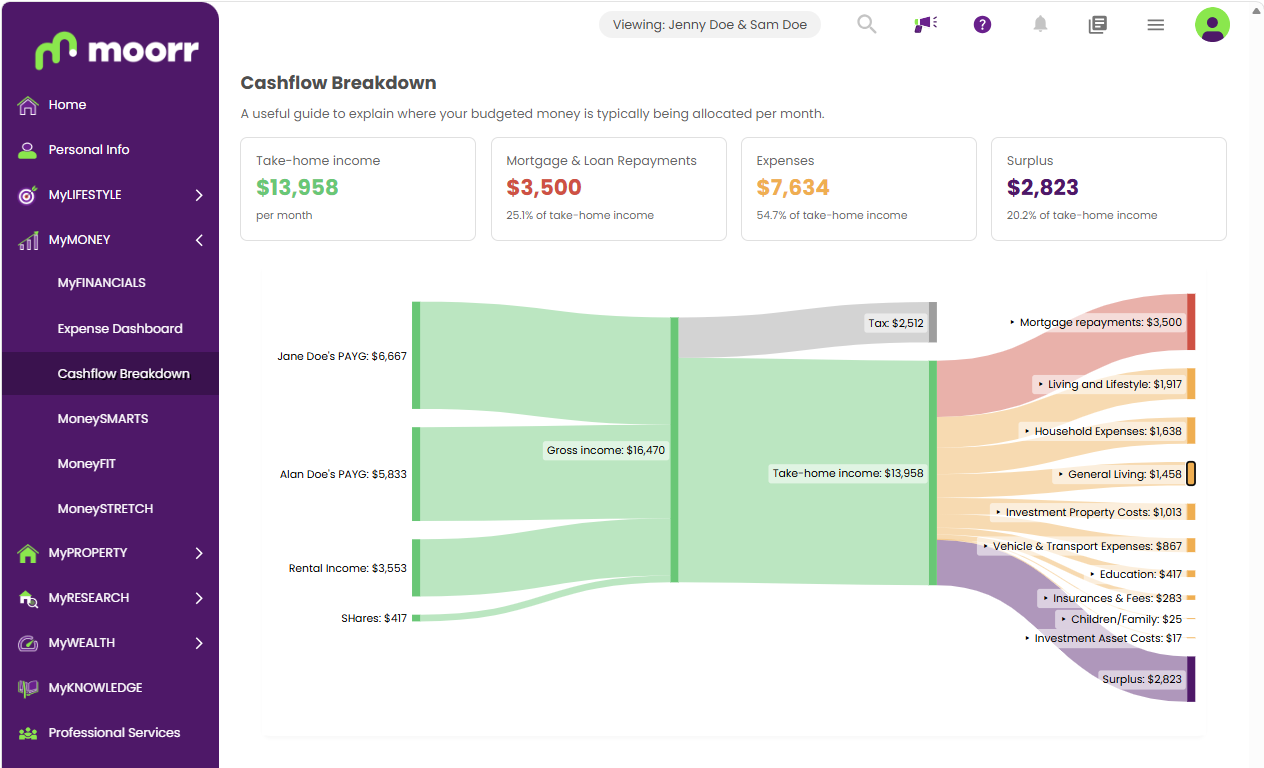
Introducing Cashflow Breakdown, a brand-new, interactive household cash flow diagram in Moorr that helps you visualise your budget and see how your income is allocated across your household finances.
And the best part? It’s FREE for all Moorr users!
Your Household Budget, All in One Picture
Instead of looking at your income, expenses and financial commitments separately, Moorr’s Household Cashflow Breakdown brings everything together in one visual map.
Using what’s known as a Sankey diagram, it shows how your household’s income flows through tax and take-home pay, then into your budgeted allocations for:
🏠 Loan repayments – including your home loan and other borrowings.
🛒 Living expenses – from groceries and utilities to holidays and school fees.
💰 Post-tax contributions – money you’ve allocated towards additional financial contributions.
🎯 Targeted surplus – the money you’re aiming to have left over.
You’ll see both the dollar amounts and how much of your income is allocated to each area.
It’s a different way of looking at your household budget, and sometimes, seeing the bigger picture can make all the difference.
How to Access Cashflow Breakdown
Ready to see your household budget in a whole new light?
- Log in to Moorr on your web browser.
- Head to MyMONEY.
- Open Cashflow Breakdown and start exploring!
Want to Dig Deeper? Just Click!
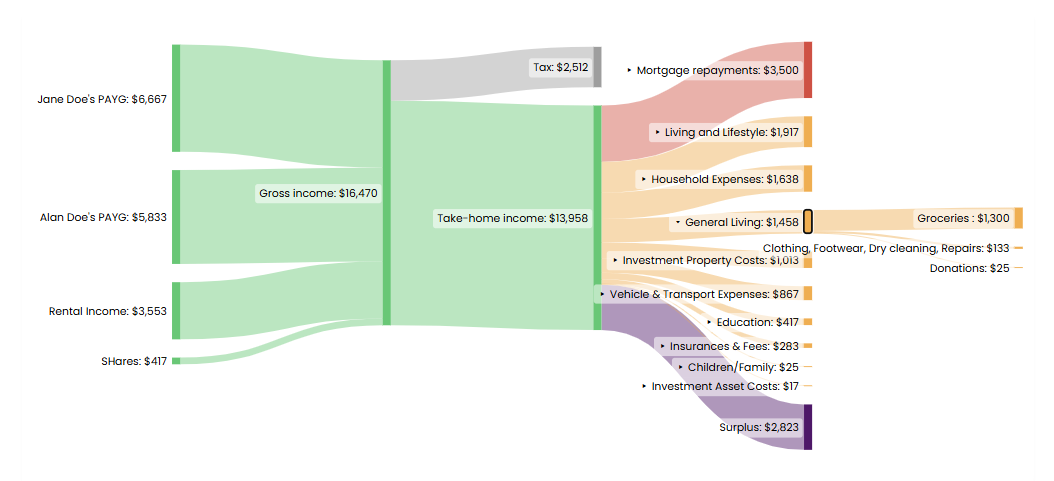
The magic doesn’t stop at the big picture. Cashflow Breakdown is interactive, so you can expand selected categories and explore the details behind the numbers.
Curious how much you’ve budgeted for groceries? Want to see how your individual loan repayments contribute to your overall commitments? Or how much you’ve set aside for holidays?
Simply click to expand the relevant section and see what’s included.
Once you can see your household’s budgeted cash flow in one place, you might start asking yourself a few questions:
- Where is most of our income being allocated?
- Are we spending too much of our budget on certain commitments?
- Does our budget actually reflect what matters most to us?
- Could we adjust something to make more room for our next financial goal?
Whether you’re working towards paying off your mortgage sooner, saving for a holiday, building your financial buffer or investing in property, understanding your planned cash flow is a great place to start.
Because managing your money isn’t just about tracking numbers. It’s about making intentional choices that support the life you want to live.
Not quite right? You can customise your expense categories!
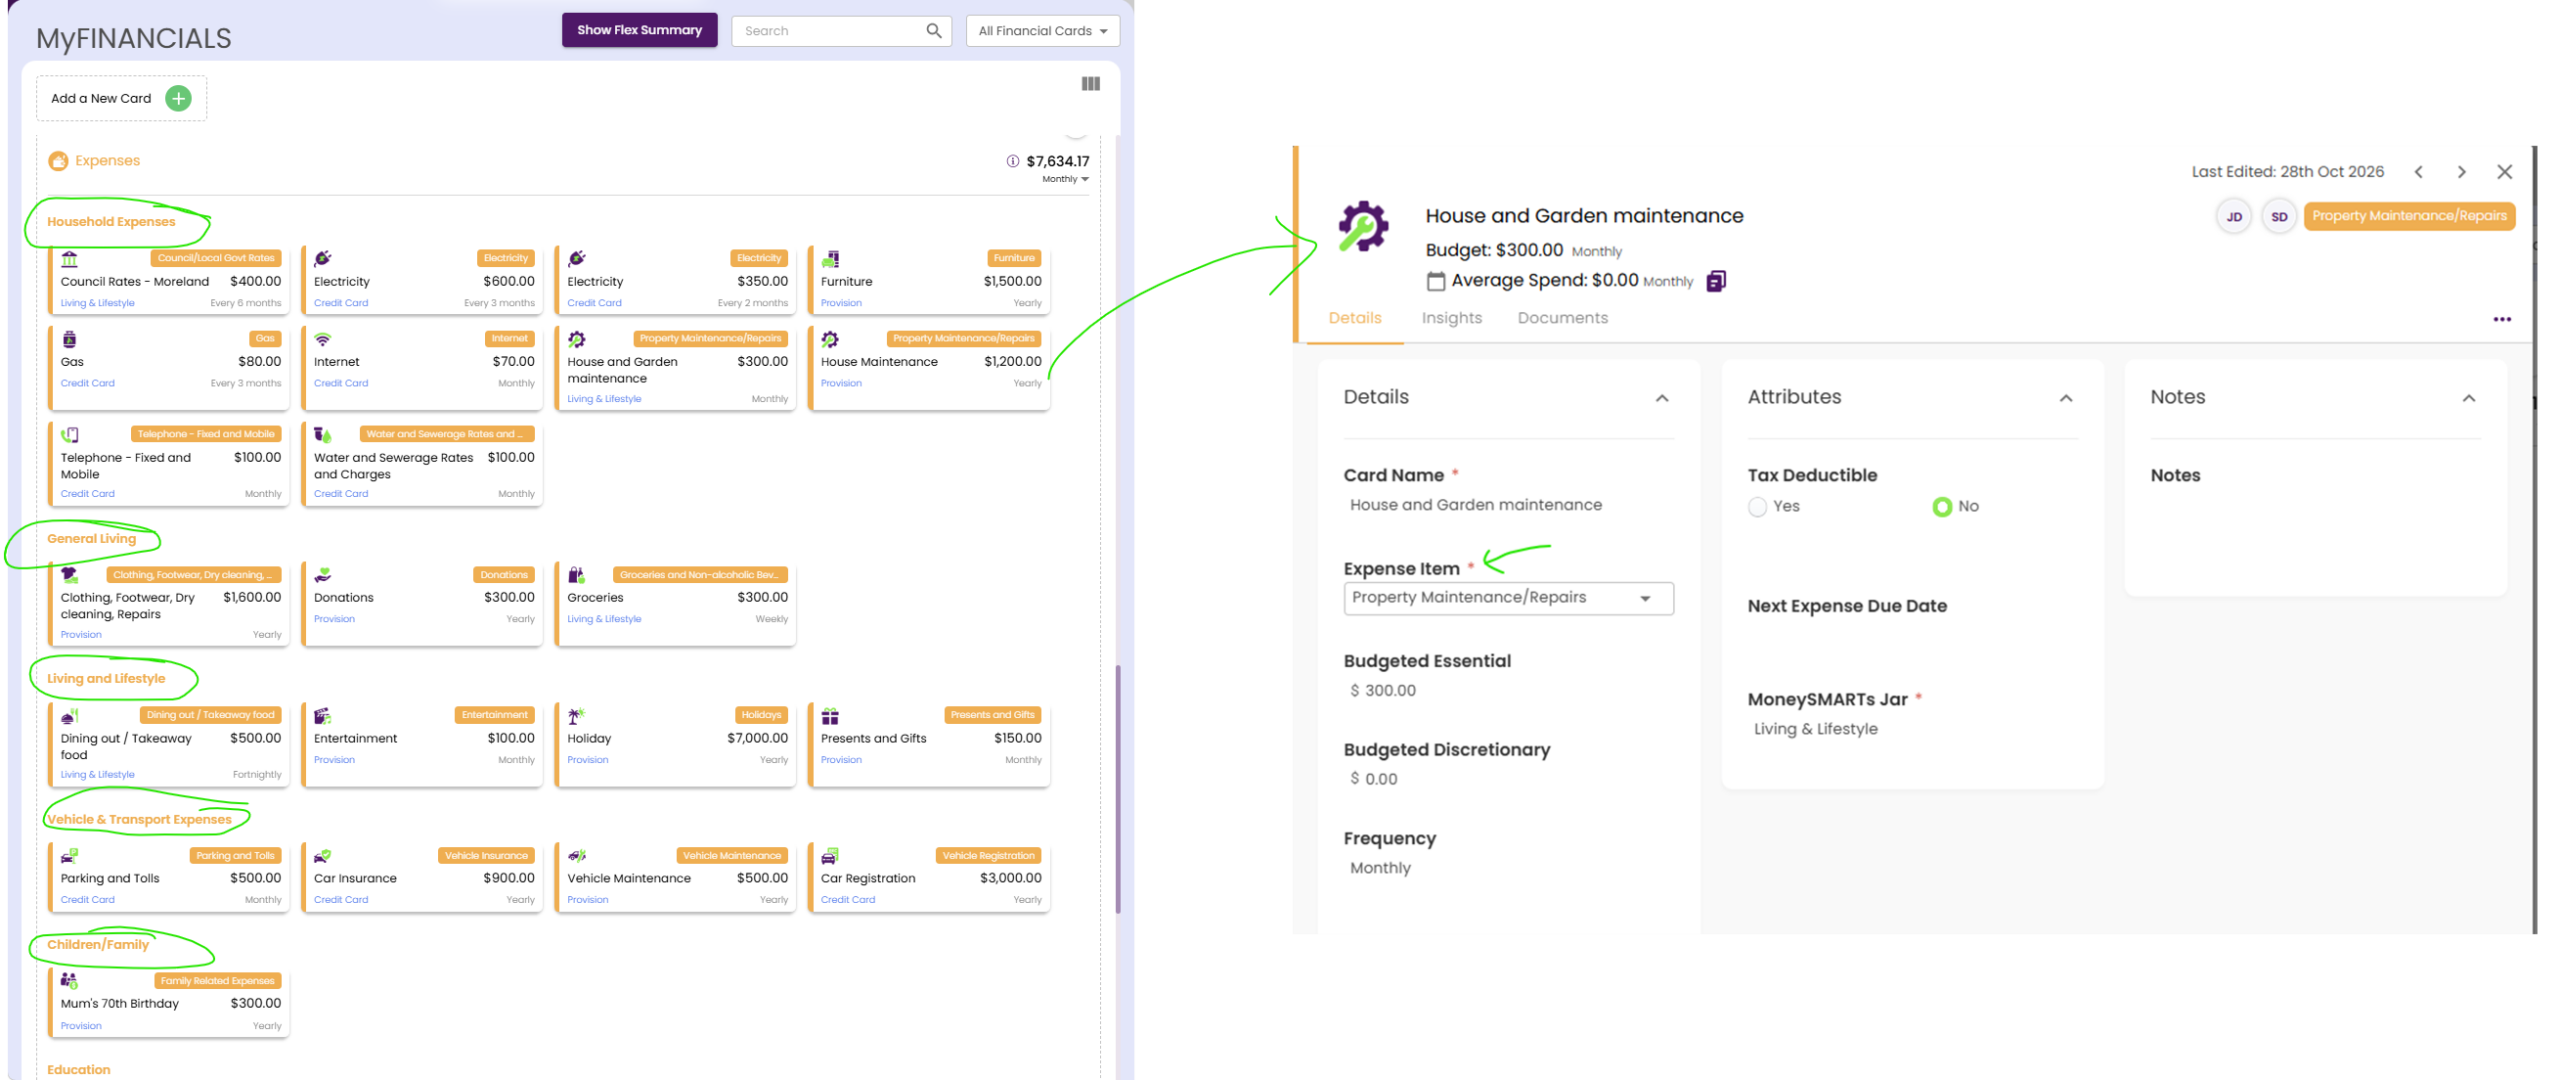
The more detailed expense breakdown is based on the Expense Item category assigned to each expense in Moorr. You’ll find these under MyFINANCIALS, where your individual expense Financial Cards are organised into categories such as Household Expenses, General Living, Living and Lifestyle, and Vehicle & Transport Expenses.
Moorr assigns default Expense Item categories, but if something doesn’t look quite right, you can change it! Simply:
- Head to MyFINANCIALS.
- Open the relevant Expense Financial Card.
- Under Details, find the Expense Item dropdown.
- Select the category that best reflects your expense.
Note: If you’re editing in bulk, try out our bulk edit feature instead.
A Quick Note About Your Numbers
The current version of Cashflow Breakdown displays your budgeted amounts and targets, not your actual spending or savings achieved. The average monthly view is calculated from your annual budget, so it doesn’t necessarily reflect which expenses or repayments fall due in a particular month.
Think of it as a visual map of how you’ve planned to allocate your money.
Ready to see where your money is going?
Log in to Moorr today, head to MyMONEY and explore your household cash flow diagram today.